Screenshots
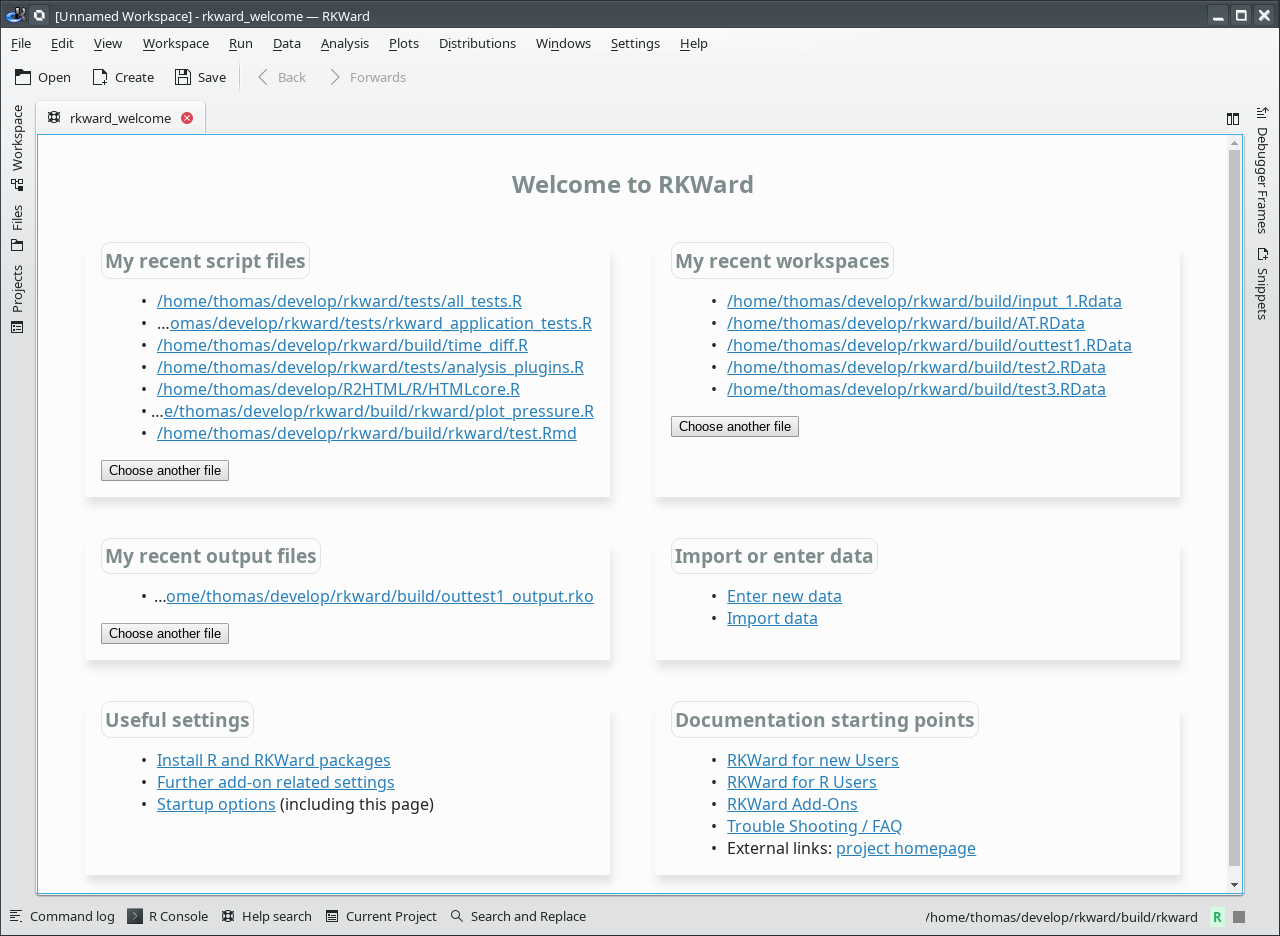
Main Window
The main application window with a dashboard of recent files and common tasks. At the left and there are several buttons to expand / collapse tool windows (RKWard 0.7.4).
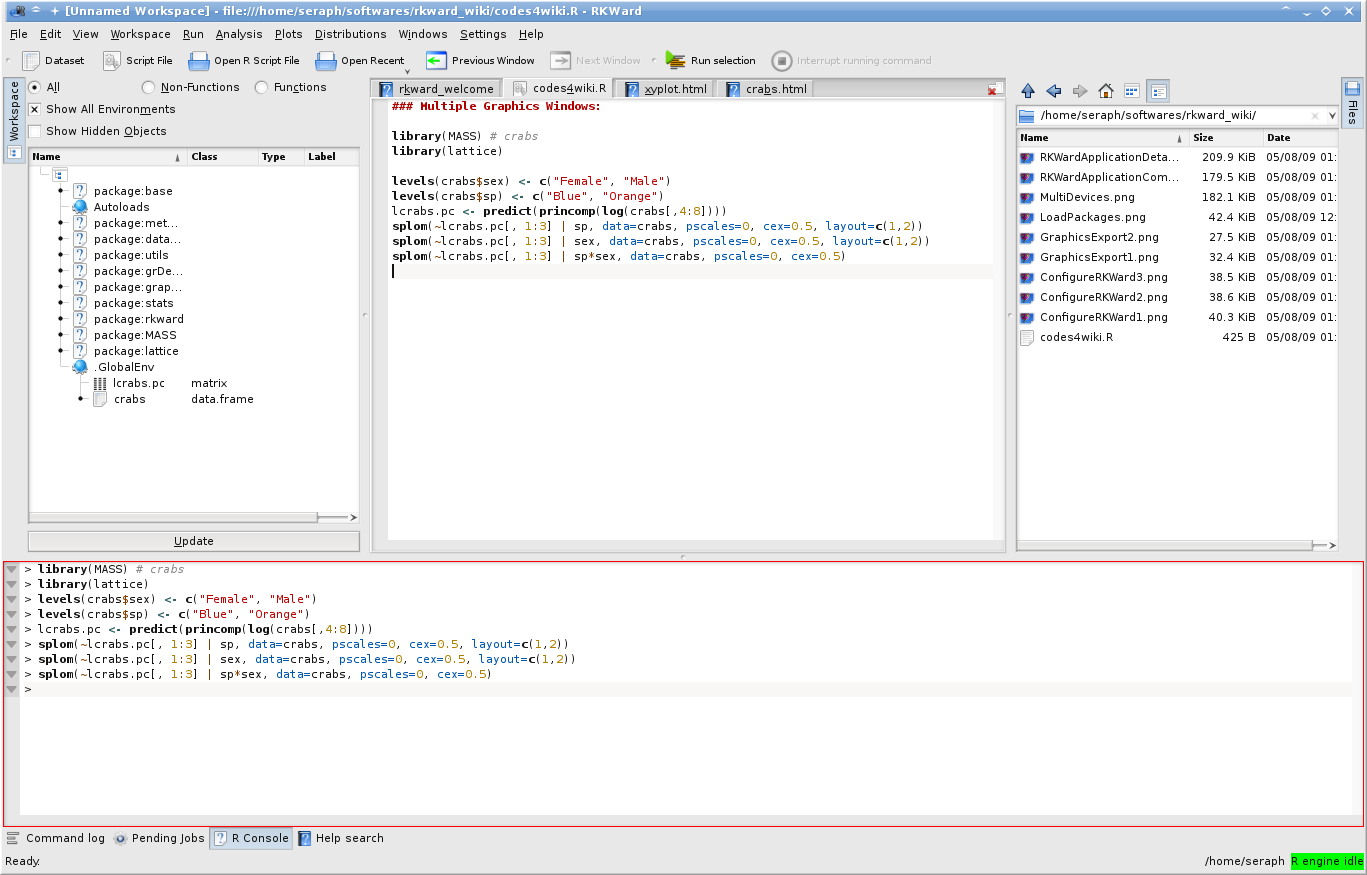
The application window with the Workspace Browser, Data Editor, File Browser, and RConsole tabs expanded and attached to the main window. The placement can be re-arranged, and each individual window can also be detached as a separate top level window (Windows > Detach).
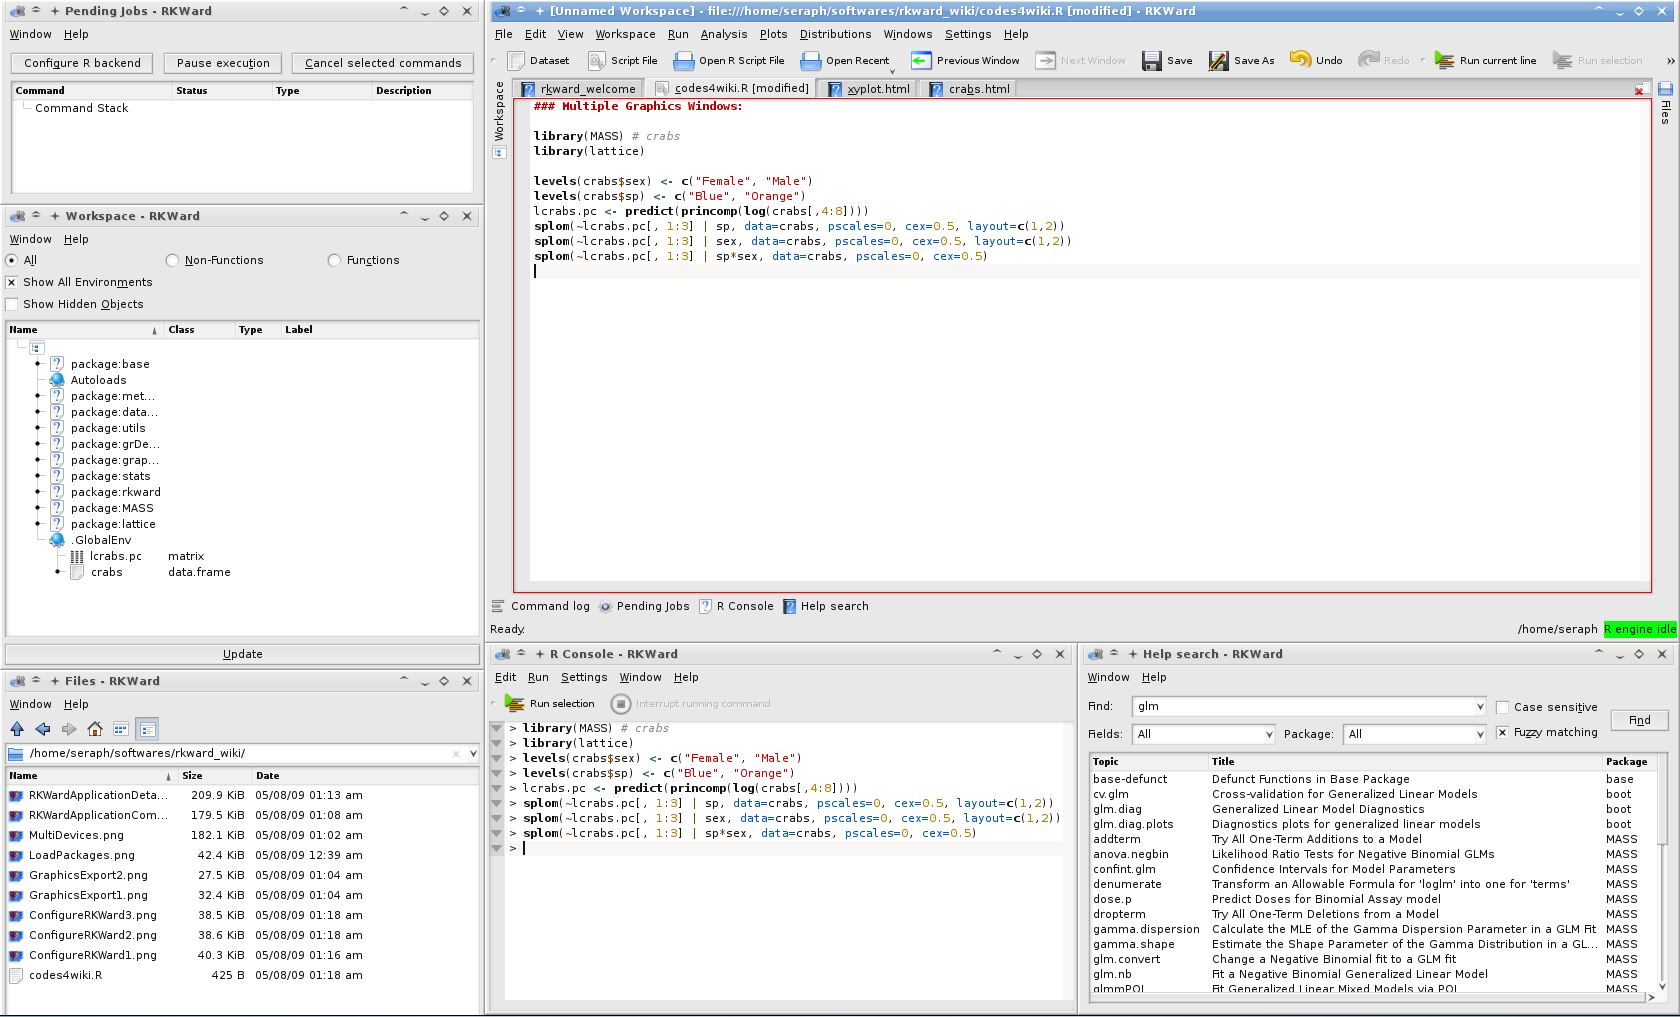
The application window with tabs detached from the main window. They can be attached back to the main window: Window > Attach to main window.
Browsing / Editing Data
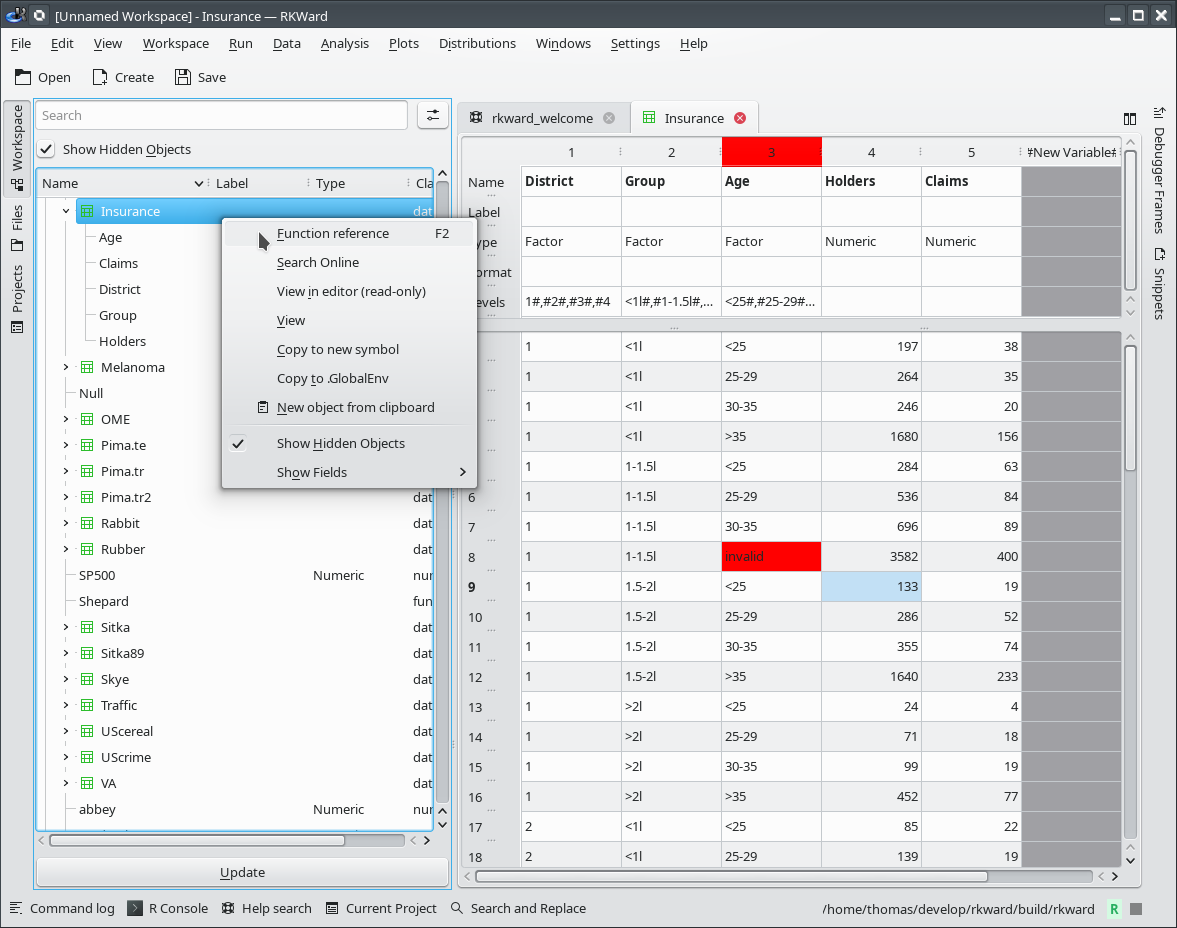
The integrated editor allows to edit data.frames. Invalid cells are marked up. The workspace browser on the left allows you to see the objects in your workspace at a glance (RKWard 0.7.4).
Editing Scripts
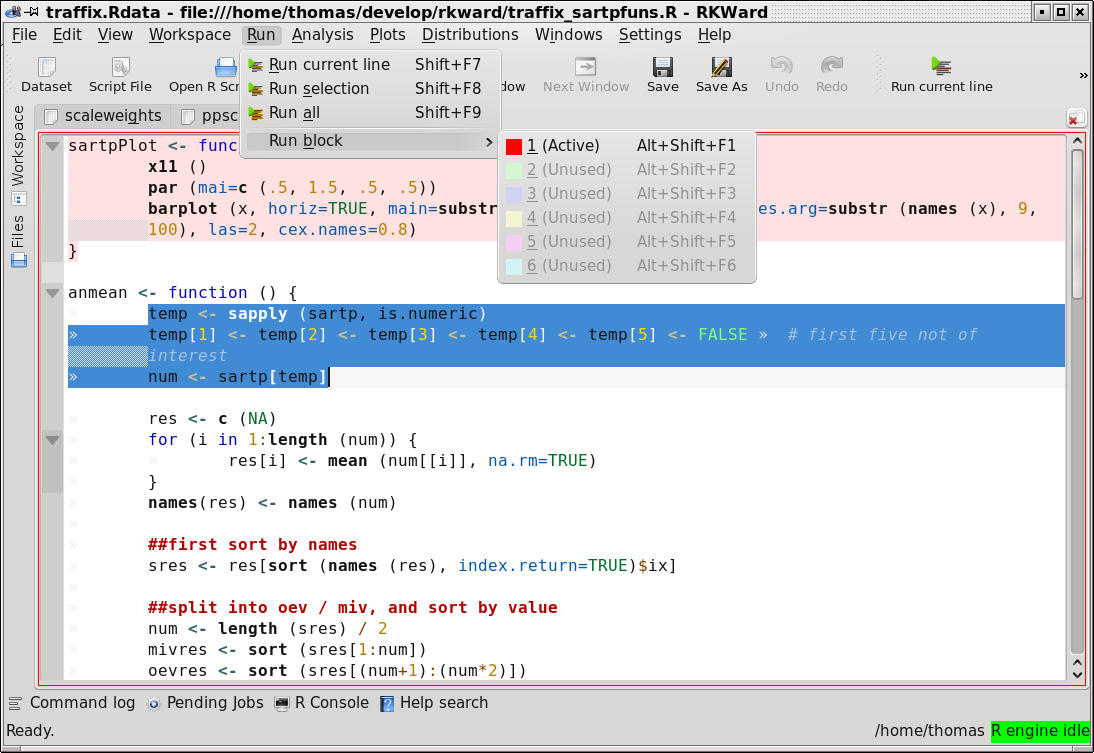
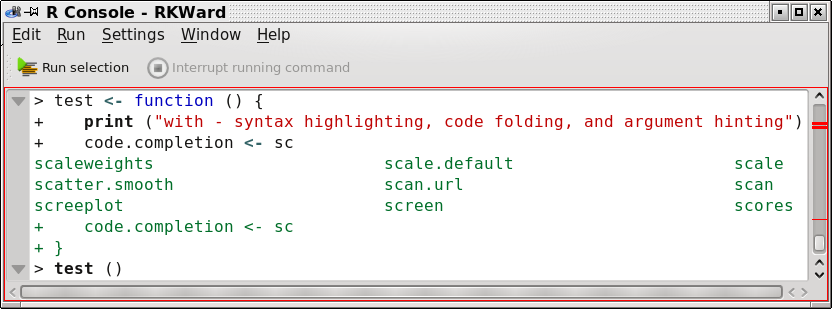
RKWard offers comfortable editing of R scripts using a built in editor. This is based on the powerful kate editor and offers - among others - syntax highlighting, object name completion, function argument hinting, and the ability to define and run various sections of code with a keyboard shortcut.
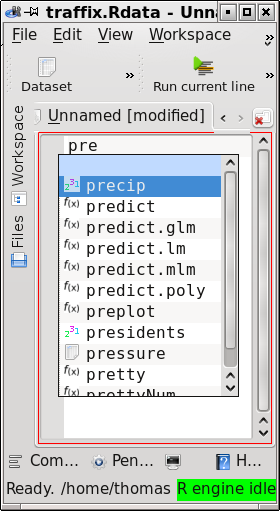
Example of object name completion
RKWard provides a live preview for editing R Markdown documents (RKWard 0.7.4).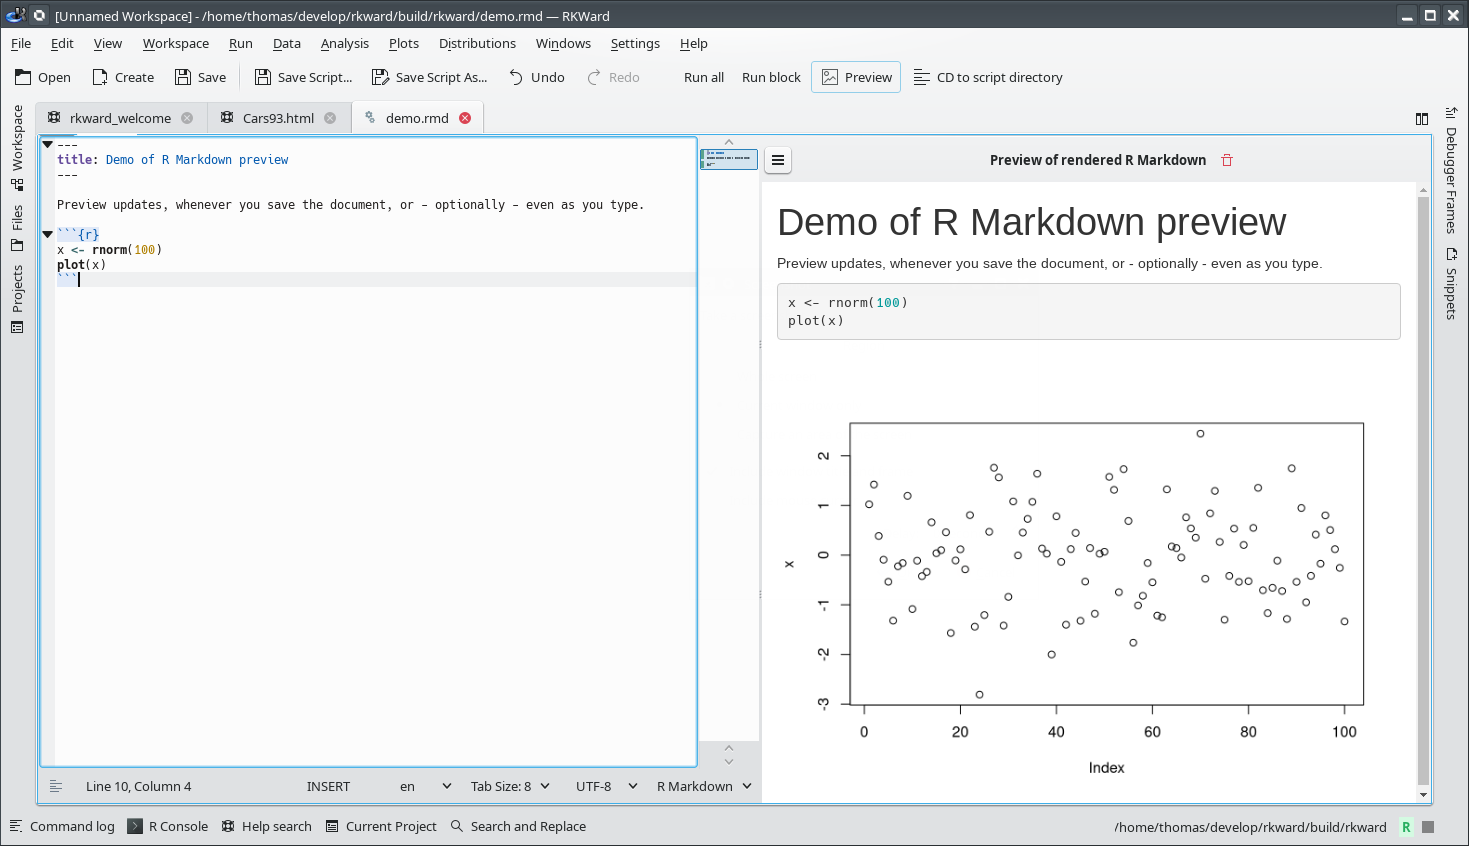
Similar previews are available for RKWard output... (RKWard 0.7.4)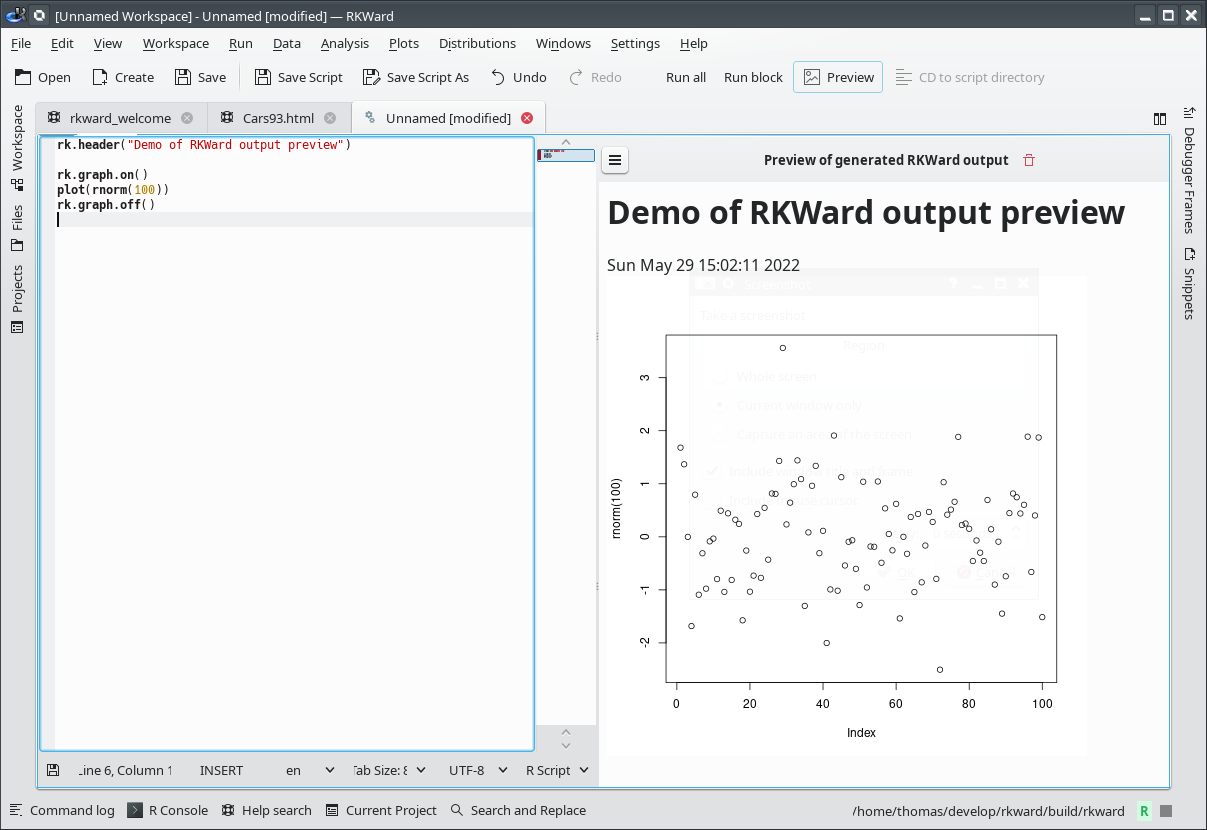
... but also for regular interactive R commands (RKWard 0.7.4)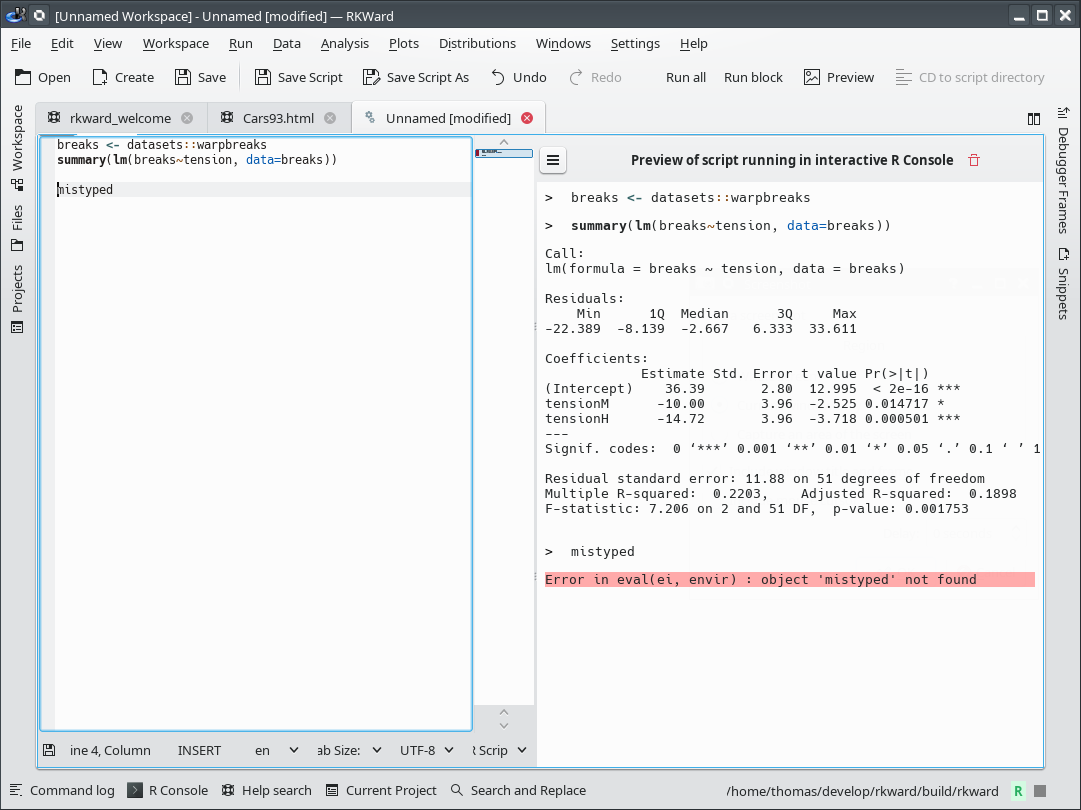
The R Console
The R Console window offers direct interaction with the R interpreter, much like a regular R Console. Here, the console window has been detached from the main application window. All tool and document windows can be separated from and reattached to the main window.
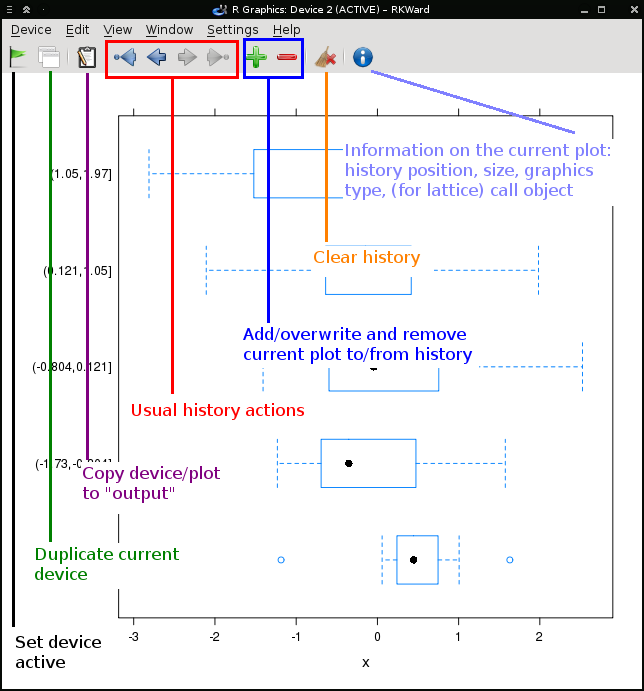
Graphics Windows
RKWard adds some helpful menu options to R's graph windows. This plot is one of those produced by "demo (graphics)" in R.
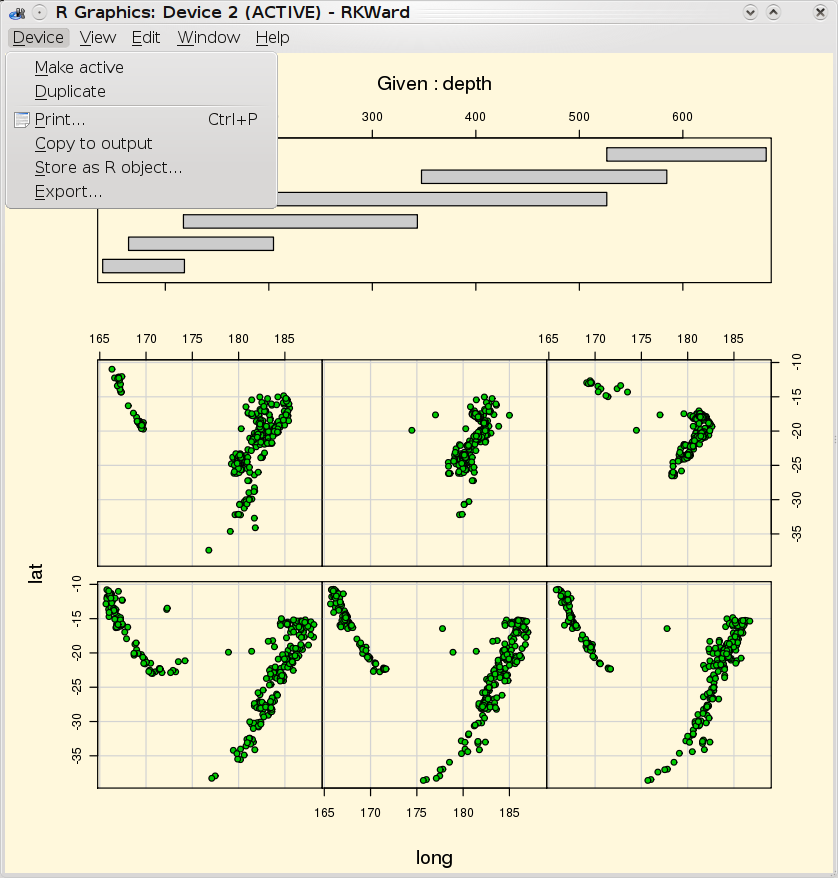
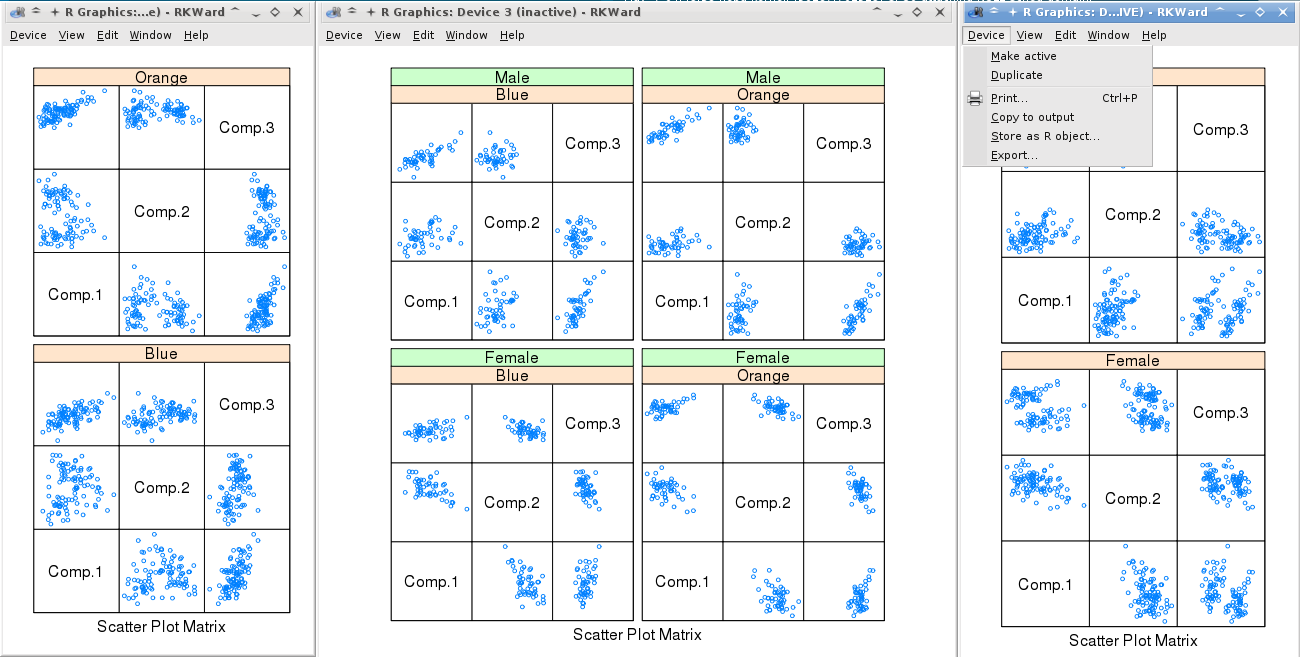
RKWard provides and easy way to create new devices (Device > Duplicate) and switch back and forth between them (Device > Make active).
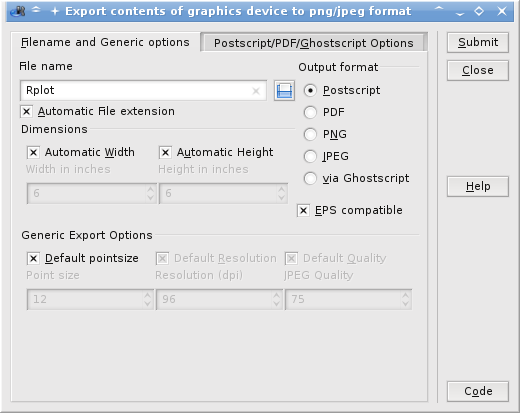
A unified plugin for exporting the graphics devices to multiple formats.
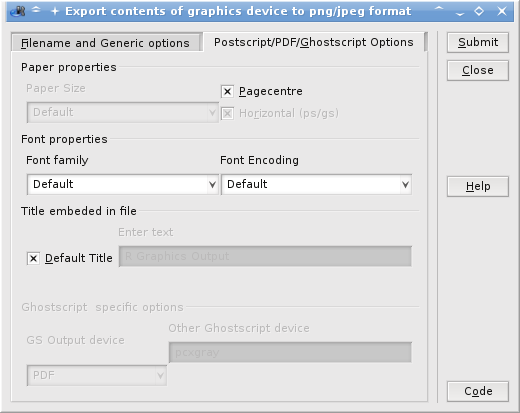
Further output specific options.
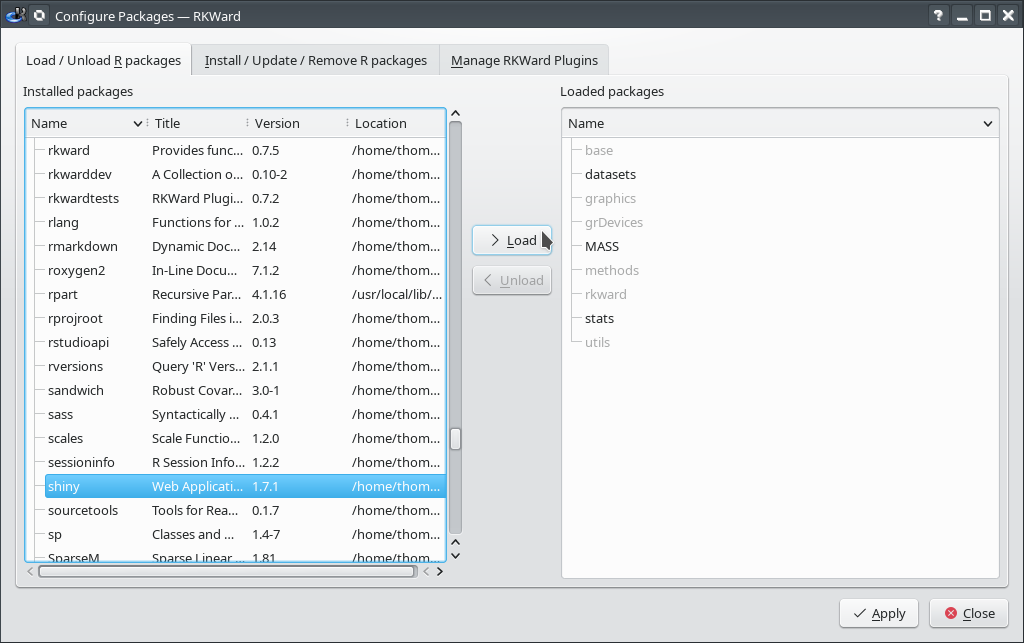
Configuring and Loading Packages
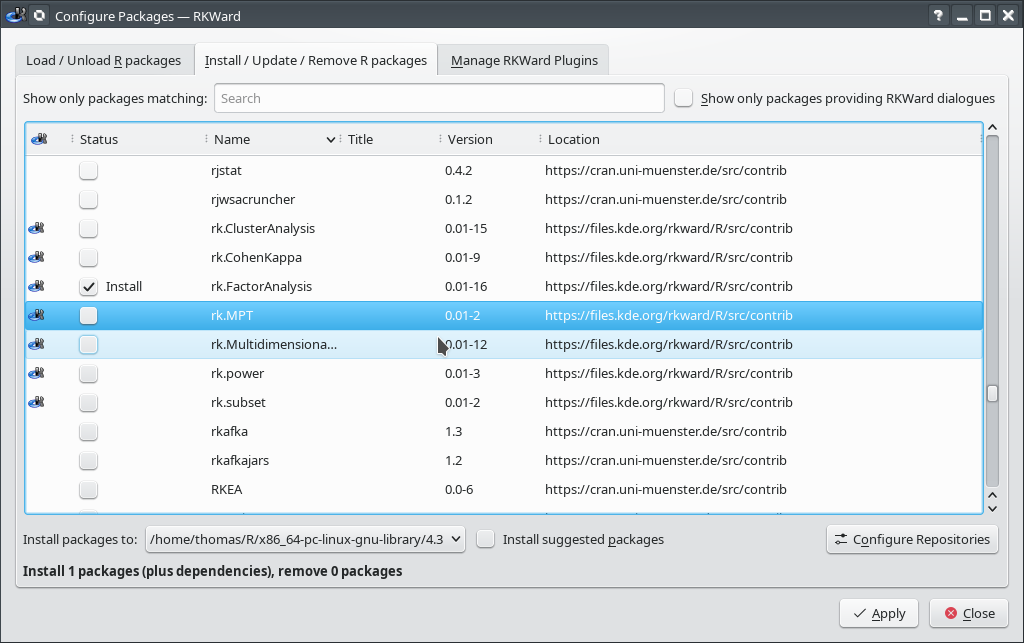
Thousands of add-on packages can be downloaded for R. RKWard offers a graphical interface to browse, install, and update such packages (RKWard 0.7.4).
This dialog allows to easily load/unload multiple packages simultaneously (RKWard 0.7.4).
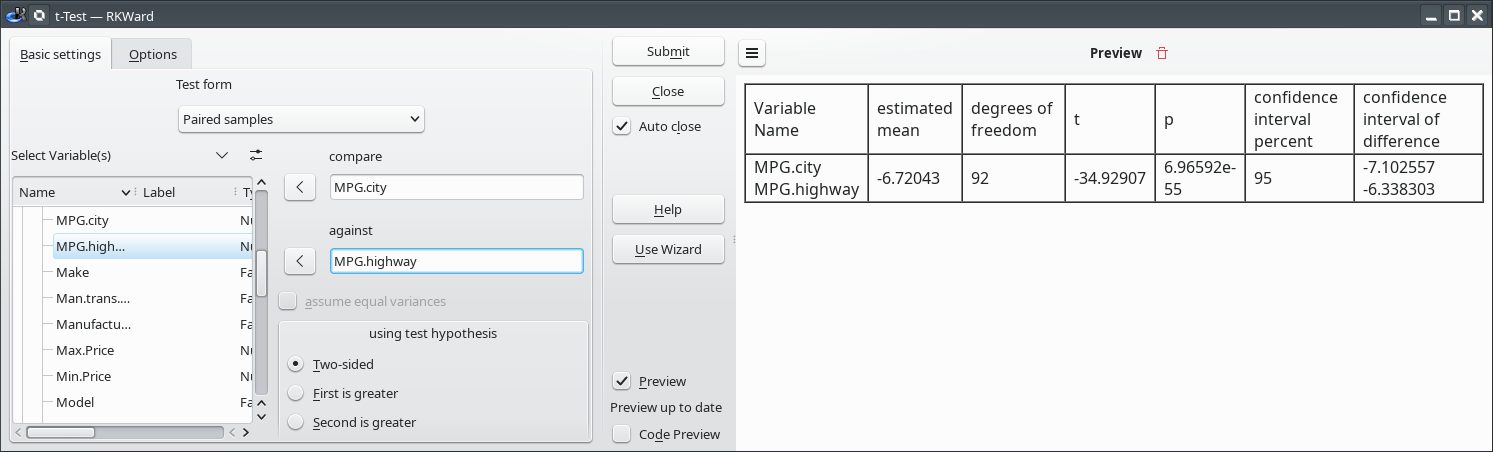
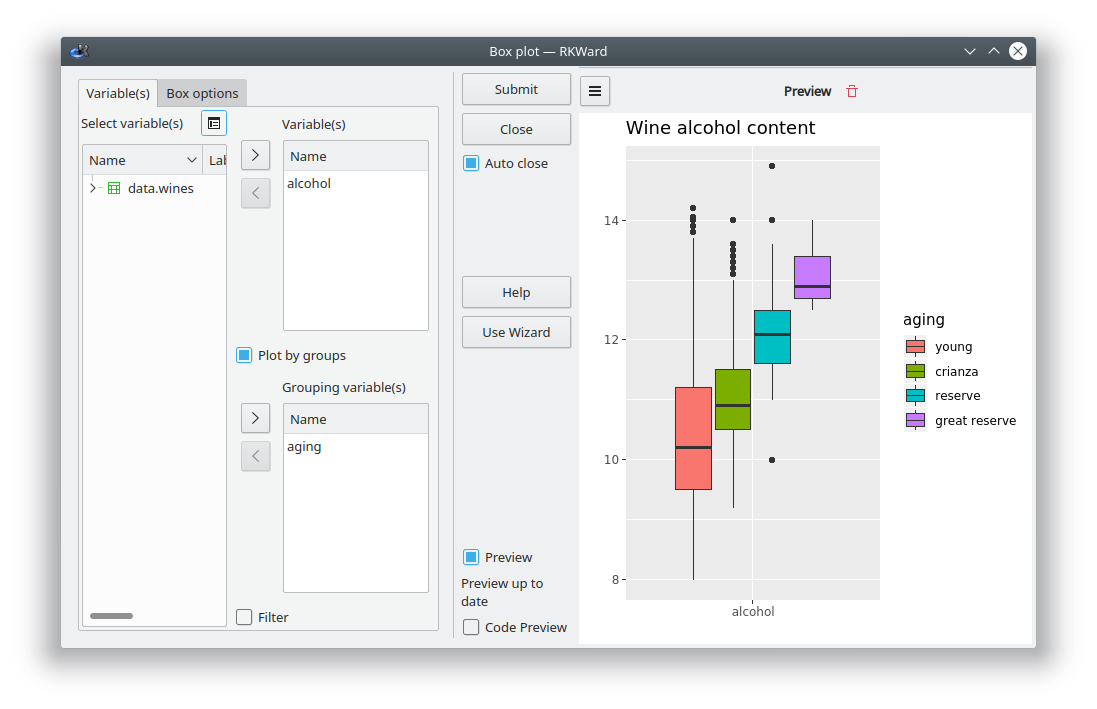
Example Dialogs: T-Test
Simple paired sample t-test plugin. Most dialogs come with a preview, so you can easily verify that all options are set up as intended, before recording the result to the output window (RKWard 0.7.4).
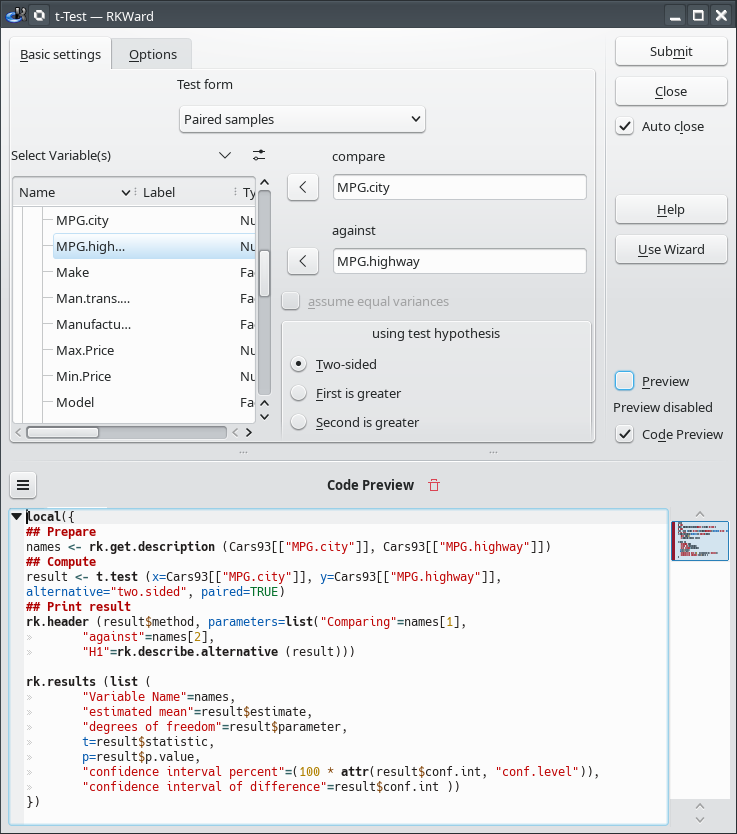
Internally, the statistical plugins simply generate R code according to your settings. You can view the generated code as you make changes, and copy-and-paste it to your own scripts (RKWard 0.7.4).
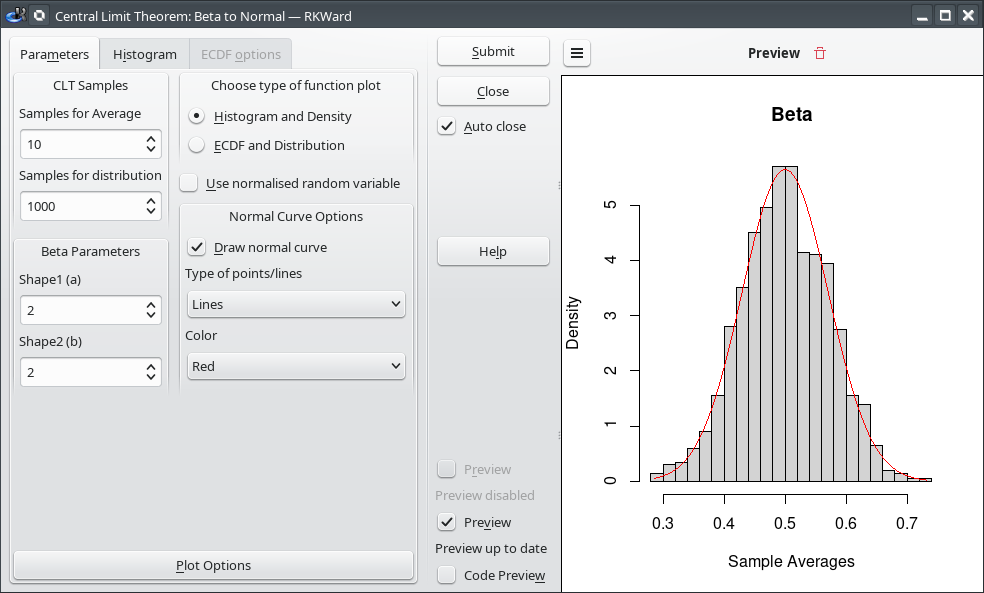
Example Dialogs: Beta CLT
This is an example of a more complex plugin. This provides a visualization of the Central Limit Theorem for the Beta distribution. The Preview graph window allows you to see the effect of your changes directly (RKWard 0.7.4).
Third party extensions
RKWard can be extended by third party plugins. The following is a screenshot from the comprehensive and highly recommendable rk.Teaching-package.
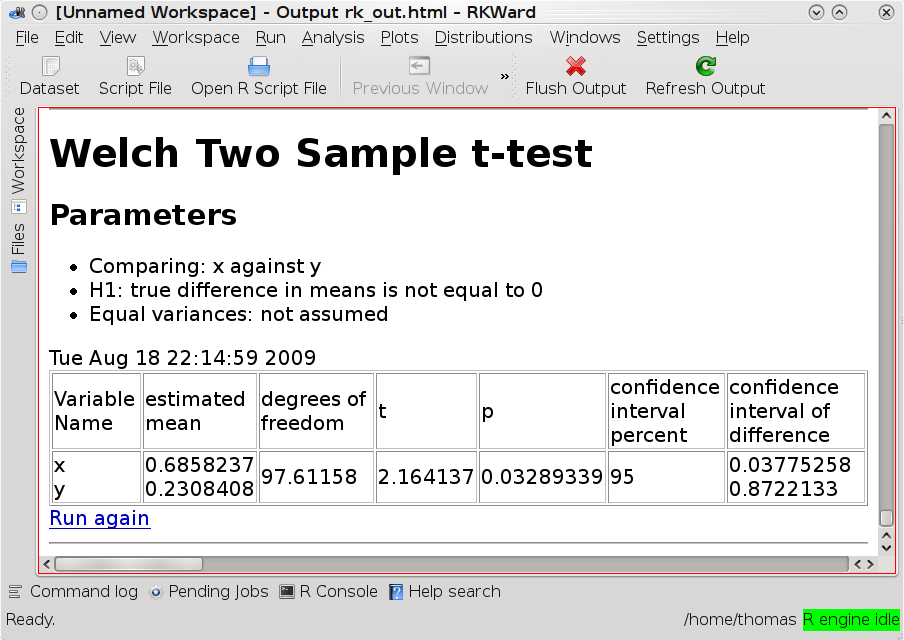
Output Window
Most plugins send their output to the Output Window, and you can also add text and graphics to the output window from custom R scripts. We are aware, this window needs a lot of improvements, but it already allows you to create a simply documentation of your anaylses, easily. The Run again-link allows you to quickly invoke the plugin again, with the same settings. This allows you to redo an analysis with new data or slightly changed options in an easy and straightforward way.
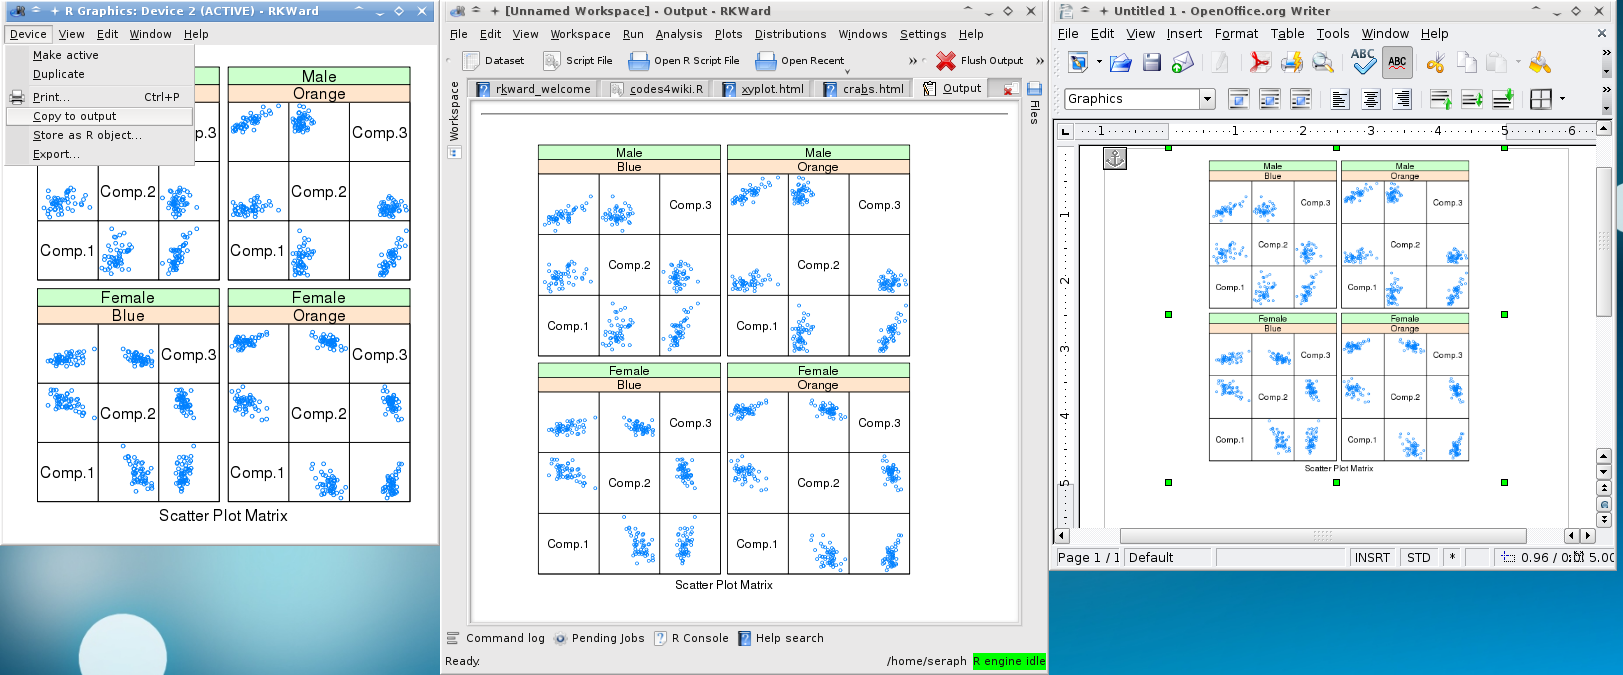
Graphics devices can be copied to the Output (Device > Copy to output) from where it can be easily dragged into an office application, such as, Openoffice.org Writer. This way exporting a R graphics and importing it into the Writer is handled on the fly!
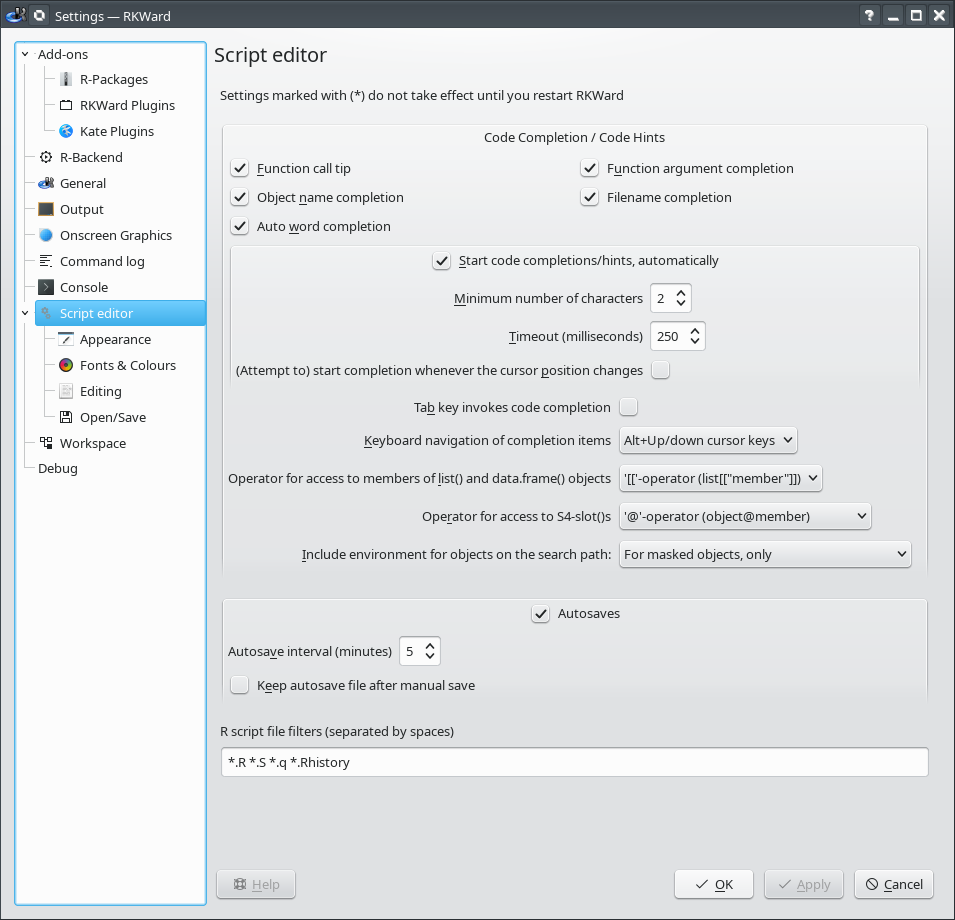
Settings Window
A glance into available configuration options (RKWard 0.7.4).
Graphics history actions
RKWard keeps a history of previous plots, allowing you to go back, easily.